The Productivity Commission – the Australian government’s highly influential economic advisory body – released a report titled Rising Inequality? last week. The question mark indicates its scepticism about other research findings on rising inequality in Australia. The commission responded to its own question in the report’s very first heading: “Over nearly three decades, inequality has risen slightly in Australia”.
This conclusion has left commentators divided. Some have celebrated this finding. Others, such as Peter Whiteford and Ross Gittins, argued the true picture is more complex.
Read more: Don't believe what they say about inequality. Some of us are worse off
We wish to point out one major flaw in the Productivity Commission’s conclusion. It ignores the deeply polarising impact of the housing boom on Australia in recent years. Our analysis shows that, once rent and mortgage costs are deducted, the rate of increase in average equivalised disposable income of the top 10 percent of households was 2.7 times faster than for the bottom 10 percent between 1988 and 2015.
On average, capital city house prices have doubled since 2003. This has benefited affluent homeowners and has disadvantaged lower-income households, especially those in long-term private rental.
Housing costs undermine gains for low-income households
We examined changes in income inequality using the same method and dataset that the Productivity Commission used, with only minimal technical differences. From 1988 to 2015, average equivalised incomes for households in the lowest 10 percent of incomes increased by 54 percent, compared with 85 percent in the highest decile. Such a difference is by no means “slight”.
However, to reveal the full extent of rising inequality, we conducted further analysis, deducting housing costs from income. This included both rent and mortgage repayments. The results were striking: from 1988 to 2015, average after-housing disposable incomes increased by only 30 percent in the lowest decile, compared with 81 percent in the highest decile.
This analysis shows that income inequality between the highest and lowest deciles nearly doubled once housing costs are taken into account. These costs hardly affected rising incomes for the top decile. For the bottom decile, housing costs nearly halved any gains in income over the same period.
Between these extremes, as the chart below shows, there is a very linear pattern across the spectrum. Housing cost impacts on disposable income's decline as household incomes rise.
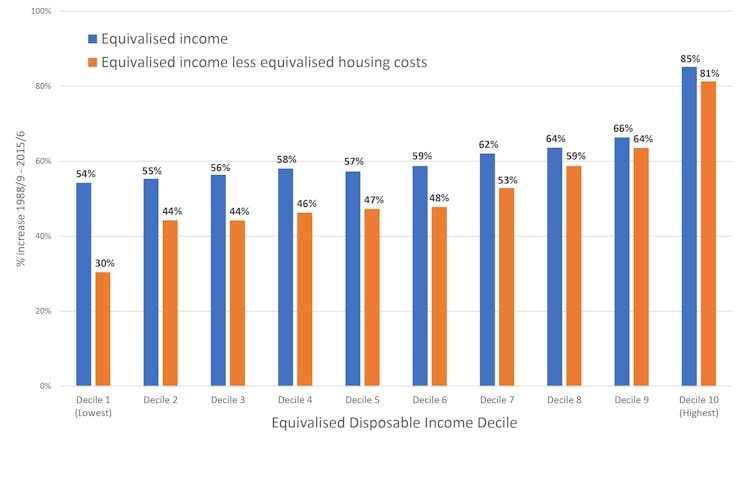
Rising gap in disposable income, before and after housing costs, 1988-2015. Authors' estimates using:ABS Microdata: Household Expenditure, Income and Housing, 2015-16 (Cat. no. 6540.0, as at 3/08/18) and ABS HES Basic confidentialised unit record file for 1988-89 (as at 3/08/18)
Housing costs account for a much higher share of lower-income households’ income. Furthermore, at the bottom end of the distribution, renters have seen their rental costs increase. This has been fuelled by low vacancy rates and the absolute supply shortage of affordable rental housing.
Read more: Three charts on: poorer Australians bearing the brunt of rising housing costs
In contrast, at the upper end of the distribution, home buyers have seen their mortgage repayments decline. This is thanks to lower interest rates and the slow but typically steady reduction in housing costs across the life course as owners pay out mortgage debt. Outright owners have not been impacted by housing costs either way.
House price growth boosts gains for wealthier households
The housing boom also played a key role in the rise of wealth inequalities, which are more extreme than income inequalities.
The Productivity Commission’s report shows that, since the early 2000s, the wealth of households in the top 50 percent grew faster than the bottom half. The upper deciles experienced average annual growth close to 3 percent. In contrast, the bottom decile experienced negative growth.
By 2015-16, those in the top 10 percent owned 45 percent of wealth. The bottom half of the distribution owned just 11 percent.
Property ownership rates are higher in the middle and upper deciles. For these households, house price growth made a major contribution to rising wealth.
In contrast, property ownership rates are relatively low in the bottom deciles. These households saw little or no wealth gains from the housing boom.
The report’s headline claiming only a “slight” rise in inequality over three decades seems to ignore this widening wealth gap as a crucial aspect of the story.
A national affordable housing plan is needed
Over nearly three decades of economic growth, living standards have improved for Australians across the board. This is good news.
But inequality has also risen significantly, which is bad news. Inequality creates unfair advantage for wealthier households and is deeply damaging for the social fabric, democratic stability and economic drive of our society.
Read more: How rising inequality is stalling economies by crippling demand
Our analysis highlights the polarising impact of the housing boom, in two primary ways. Firstly, increasing housing costs undermined income gains for less affluent households. Secondly, house price growth increased wealth gains for more affluent households.
This analysis shows that rising inequality cannot be redressed without some redistribution of housing wealth and costs.
The Productivity Commission report commended the “equalising effect” of Australia’s progressive income tax. Including housing in our analysis, however, points to the polarising effect of taxation on wealth and housing. The tax system disproportionately benefits more affluent home owners and property owners.
An increased supply of affordable rental housing is crucial to reduce the gap in after-housing disposable income. Low-income private renters also need greater security of tenure, including more stringent controls on rent increases.
A renewed focus on affordable home purchase schemes for people on moderate incomes can help reduce the wealth gap. In addition, housing tax levers, used well, can help reduce both wealth and income inequalities over time.
Ilan Wiesel, Senior Lecturer in Urban Geography, University of Melbourne; Liss Ralston, Urban Statistician, Centre for Urban Transitions, Swinburne University of Technology, and Wendy Stone, Associate Professor, Centre for Urban Transitions, Swinburne University of Technology
This article is republished from The Conversation under a Creative Commons license. Read the original article.
